Monday, October 31, 2011
Post 9 Response
An interesting application of nanotechnology that I would like to see would be incorporated into guitar strings mostly by use of nano-wires.
Post 8 Response
I have below a link discribing all the different applications for nanotechnology
http://en.wikipedia.org/w/index.php?title=List_of_nanotechnology_applications&oldid=455543026
But out of all the applications that nanotechnology offers one of my favorite ideas has come from Dr. Mike Zach at UWSP, a former chemistry professor of mine. He is currently working on a knife composed of nano-wires. The neat thing about this knife is that it never dulls its edge. As one uses the knife, the nano-wires "peel" off therefore keeping the knife sharp.
Here are some links pertaining to him.
http://www.uwsp.edu/chemistry/pages/faculty/zach.aspx
http://mpzachphotography.com/about/about.htm
http://chemdept-nmr.uwsp.edu/~mzach/MZach_Scientific_Background.html
I hope these intrigue you
Enjoy!!
Post 10 response
I didnt participate in the lab this day but this is a link to one of my favorite SEM photos. I love how it shows every little detail.
http://en.wikipedia.org/wiki/File:Soybean_cyst_nematode_and_egg_SEM.jpg
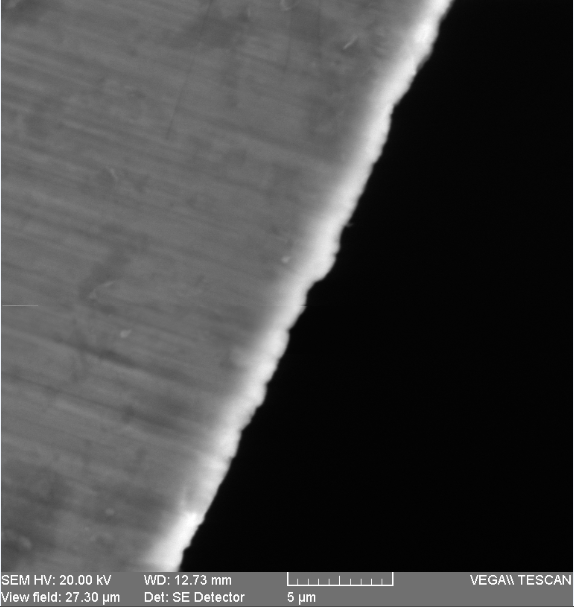
UPDATE:::
Here is the SEM images from our group. This is a razorblade

http://en.wikipedia.org/wiki/File:Soybean_cyst_nematode_and_egg_SEM.jpg
UPDATE:::
Here is the SEM images from our group. This is a razorblade
Monday, October 17, 2011
Utilizing the difrfaction slides and laser pointers address the following questions.
1. What is the 4 patterns printed on the slides? Somehow draw and post this pattern on your blog, and explain how you arrived at this pattern.
Top Left-Fine Vertical Dotted Line
Top Right-Fine Horizontal Dotted Line
Bottom Left-Rough Vertical Dotted Line
Bottom Right-Rough Horizontal Dotted Line
2. Determine the distance between the line patterns, and how think the lines may be.
The distance is approximately estimated at 150nm for the rough horizontal and vertical lines and about 80nm for the fine horizontal and vertical lines
3. Setup the light wave simulator to simulate the patterns on the 35 mm slides. Grab a picture of these simulations and post them for each of your patterns.

4. Green Light is able to measure smaller things much better than red light due the the lower wavelengths.

Thursday, October 6, 2011
Wave Lab Response
1) Amplitude different with frequency constant
Amplitude at 25% = .8 cm
Amplitude at 50% = .8 cm
2) Frequency different with amplitude constant.
Frequency at 25% = 3.16 cm
Frequency at 25% = 1.8 cm
3) By adjusting the amplitude of the wave you do not change the wavelengths, only the height of the waves. Whereas adjusting the frequency will change the wavelength but not the height of the waves.
4) X -> A ~ 4.20cm Y -> A ~ 4.20cm
X -> B ~ 4.28cm Y -> B ~ 6..62cm
X -> C ~ 6.60cm Y -> C ~4.32cm
X -> D ~ 6.65cm Y -> D ~ 8.01cm
X -> E ~ 6.57cm Y -> E ~ 6.62cm
X -> F ~ 7.90cm Y -> F ~ 6..55cm
Distance of Wavelength = 2.8cm
Distance Between X & Y = 5cm


Comparing the constructive interference with the measurements, I can conclude that the distance between wavelengths cause by the drips is approximately the same to slightly bigger at each point.
Monday, October 3, 2011
Blog Post 2
Questions:
1. Fast Up and Down takes more energy.
2. fast frequency corresponds to high energy.
3. 1/1.02 seconds = .98 Hz
4. 1/.27 seconds = 3.70 Hz
5. 1/1.02 seconds = .98 Hz.
6. 60 cm.
7. 16 cm.
8. Energy and frequency are dependent on each other while wavelength is inversely dependent on energy and frequency. Example: The more energy that is put into a wave yields a higher frequency but a smaller wave length and vice versa. Red light has less energy than blue light as well as a bigger wave length than blue light.
Subscribe to:
Posts (Atom)